To evaluate robot cleaning coverage data, start by reviewing heat maps and coverage maps to identify missed areas or overlaps. Look for patterns indicating unreachable spots caused by obstacles or furniture. Check coverage percentage and compare multiple runs to spot inconsistencies. Use visualizations to assess evenness and detect gaps, then recalibrate sensors or adjust paths as needed. Staying attentive to these details helps guarantee peak performance, and exploring further will reveal even more effective strategies.
Key Takeaways
- Use coverage maps to visually identify cleaned versus missed areas and detect patterns of neglect or overlap.
- Analyze coverage percentage metrics to assess overall cleaning completeness and identify potential gaps.
- Compare multiple cleaning runs to detect inconsistencies and evaluate the impact of environmental changes.
- Monitor sensor accuracy and calibration status to ensure reliable data collection and navigation performance.
- Regularly review visual data to optimize path planning and adapt to environmental obstacles for improved coverage.
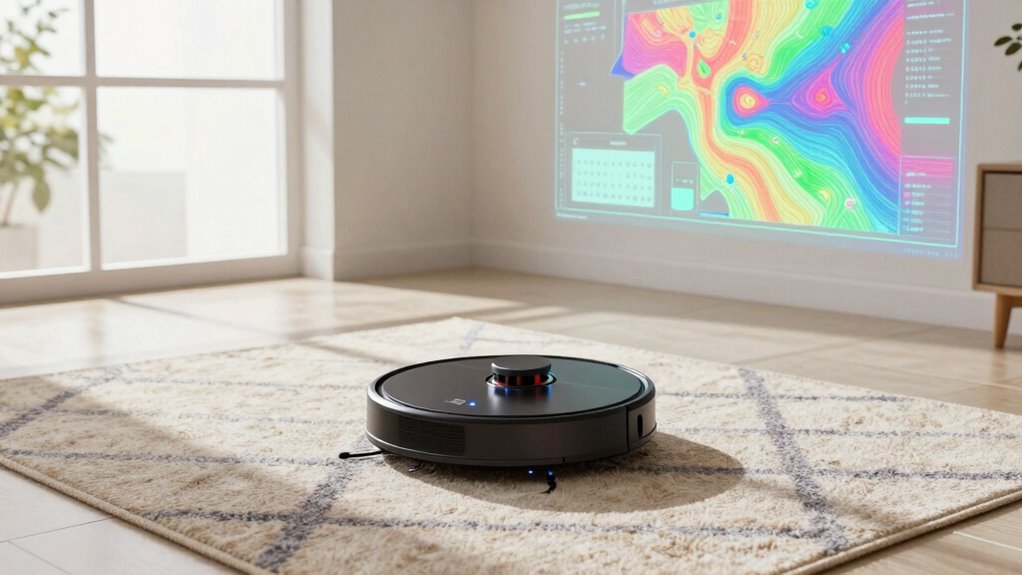
Data visualization plays a fundamental role here. Visual tools like heat maps or coverage maps make it easier to interpret complex data, revealing which areas the robot has cleaned thoroughly and which spots might have been missed. By translating raw data into visual formats, you can quickly identify patterns, overlaps, and gaps in the cleaning process. For example, a heat map highlighting high-traffic zones can show you where the robot spends the most time, while cooler areas may indicate uncleaned sections. Using these visualizations, you can assess whether the robot is covering the entire space evenly or if adjustments are necessary. Additionally, understanding coverage metrics can help you better interpret the data and identify areas for improvement. When evaluating coverage data, consider the coverage percentage as a key metric. A high coverage percentage indicates that your robot has cleaned most of the area, but it’s also essential to look at the distribution. Even coverage guarantees no corners or edges are neglected, so examine the coverage maps closely for any blind spots. Sometimes, obstacles or furniture placement can create hidden corners that the robot struggles to reach. If you notice persistent missed spots, you might need to reconfigure the environment or adjust the robot’s path planning. Furthermore, compare the cleaning times and coverage patterns across multiple runs. Consistent gaps in coverage or prolonged cleaning times could signal calibration issues or navigation problems. If you notice discrepancies, recalibrate sensors or update the robot’s mapping algorithms. Regular coverage analysis is crucial because environmental changes can impact the robot’s ability to perform effectively. Incorporating advanced data analysis tools can further enhance your understanding of the robot’s performance and help optimize its operation. Additionally, monitoring sensor accuracy can help you identify calibration issues early. It is also beneficial to consider how environmental factors like layout and clutter affect the navigation efficiency of the robot. Remember, ongoing evaluation is essential; as your environment changes, so should your robot’s calibration and coverage assessments. Regularly analyzing coverage data with clear visualization tools ensures your robot operates at peak efficiency, maintaining a clean space with minimal oversight.

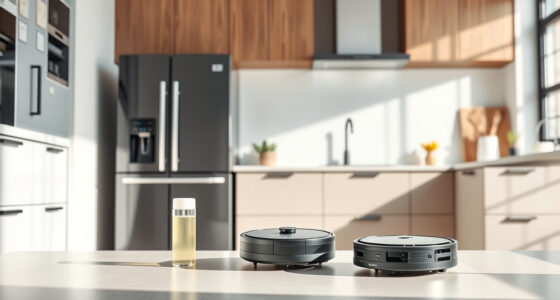
Tikom Robot Vacuum and Mop, 6000Pa Robotic Vacuum Cleaner with Self-Emptying Base, 90 Days Capacity, LiDAR Navigation, Home Mapping, Ideal for Pet Hair, Hard Floors, Carpet (L8000 Plus)
- Long-Lasting Self-Emptying: 90-day capacity with 3L dustbag
- Powerful 6000Pa Suction: Removes pet hair and deep dirt
- Adaptive Suction on Carpets: Automatically increases suction on carpets
As an affiliate, we earn on qualifying purchases.
As an affiliate, we earn on qualifying purchases.
Frequently Asked Questions
How Accurate Is Robot Cleaning Coverage Data?
Robot cleaning coverage data is generally accurate when sensor calibration is properly maintained. Regular calibration guarantees sensors detect obstacles and coverage zones correctly. You should also use data visualization tools to analyze coverage maps, identify missed spots, and assess cleaning efficiency. Keep in mind that factors like sensor quality, environmental conditions, and maintenance impact accuracy. Regularly updating calibration and reviewing visualized data help you optimize your robot’s cleaning performance.
What Sensors Influence Coverage Data Reliability?
Sensors like lidar, cameras, and bump sensors influence coverage data reliability. You should guarantee proper sensor calibration to maintain accuracy. Data integration from multiple sensors improves coverage mapping by providing thorough environment details. When sensors are correctly calibrated and data from various sources are combined effectively, your robot’s cleaning coverage becomes more reliable, reducing missed spots and enhancing overall cleaning performance.
How to Identify Coverage Blind Spots?
Imagine your robot’s cleaning path as a map explorer’s trail. To spot blind spots, check for areas where mapping accuracy falters—like shadows hiding treasures. Use obstacle detection data to reveal gaps where the robot hesitates or misses. By analyzing these signals, you identify zones it overlooks, much like shadows cast by trees. Improving sensor calibration guarantees your robot’s map is complete, illuminating every corner with confidence.
Can Coverage Data Improve Cleaning Efficiency?
Yes, coverage data can considerably improve your cleaning efficiency. By analyzing cleaning algorithms and using data visualization, you can identify areas that need more attention and optimize your robot’s paths. This process helps you understand coverage patterns, reduce missed spots, and enhance overall performance. Regularly reviewing this data allows you to fine-tune settings, ensuring your robot cleans smarter, faster, and more thoroughly.
How Often Should Coverage Data Be Reviewed?
You should review coverage data weekly to keep your cleaning effective. Did you know that 80% of issues can be caught early with regular data checks? By analyzing trends through data visualization, you can identify areas needing attention. Incorporating this into your maintenance schedules guarantees your robot cleans efficiently. Regular reviews help spot irregularities and improve overall performance, making your cleaning routine more successful and less prone to unexpected breakdowns.
Conclusion
By benchmarking your robot’s coverage data with precision, you’ll effectively evaluate its efficiency and uncover areas needing improvement. Breaking down the data diligently helps detect dirt and dead spots, boosting cleaning brilliance. With a keen eye and consistent checks, you’ll confidently control your cleaning, creating a cleaner, happier home. Remember, thorough review and reliable results go hand in hand—so stay systematic, stay sharp, and let your robot’s performance shine!